
M61 Southbound lane 1 closure (MP 3/3 to 0/8)
Due now- What
- 1 lane closed
- Why
- Maintenance work
- When
- 10pm yesterday to 6am today (UK time)
Start time has passed, so it may already be in place
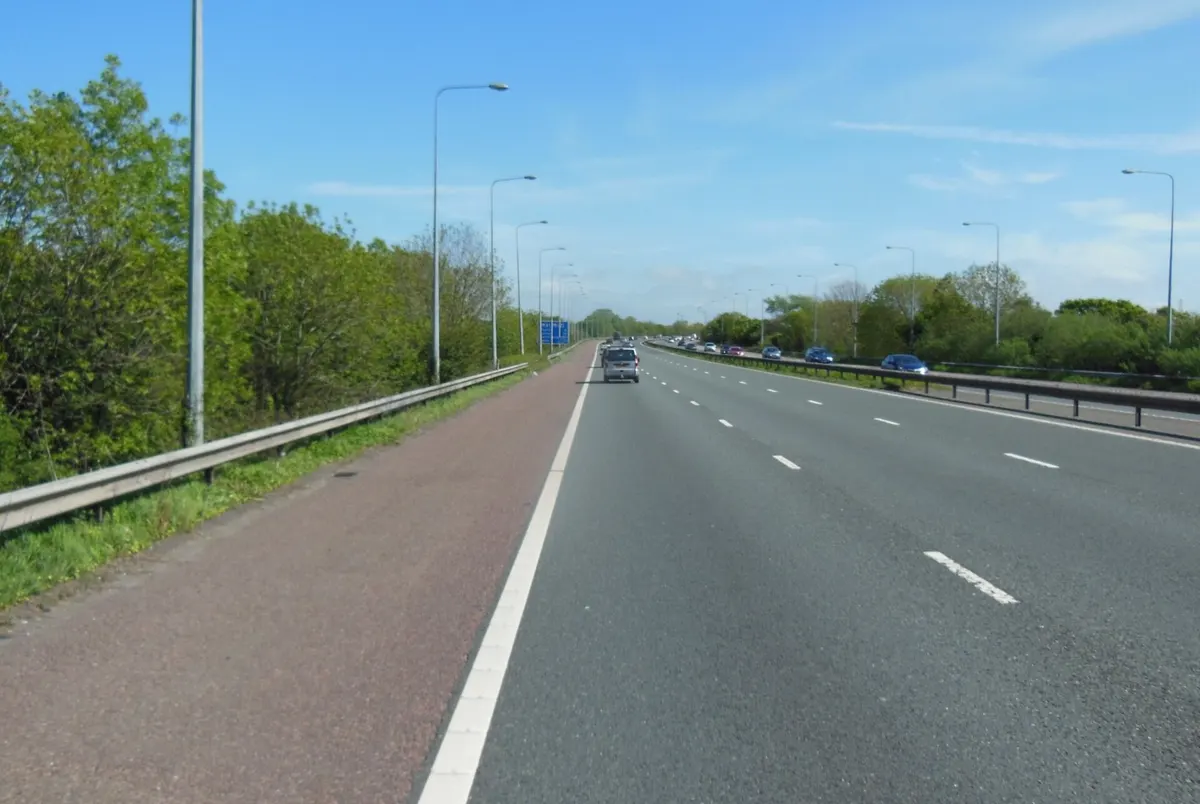
Roadworks and lane closures
Nothing is confirmed closed on the M61 right now. National Highways has 3 closures booked in the next 24 hours, the first due from 10pm, so it may already be in place. Its slowest recurring hour is Tue 07:00, averaging 7 mph.
Photo: Ian S, Geograph, CC BY-SA 2.0, resizedClosure data updated 34 minutes ago
None confirmed in force
Our last check saw nothing set up on the M61, but closures are booked for tonight below. This covers planned closures, not accidents.
M61 Southbound lane 1 closure (MP 3/3 to 0/8)
Due nowM61 southbound lanes 2 and 3 closure (MP 10/3 to 8/5)
BookedM61 Southbound to M60 Clockwise link road lane 2 closure
BookedThese are closures National Highways has scheduled, mostly overnight. Plans can change on the night, and a closure only shows above as in force once our last check has seen it set up, so one that has passed its start time may already be in place.
Measured about 400 m from junction 2, Worsley Braided Interchange, in Bolton
Measured about 400 m from junction 2, Worsley Braided Interchange, in Bolton
Measured about 400 m from junction 2, Worsley Braided Interchange, in Bolton
Measured about 400 m from junction 2, Worsley Braided Interchange, in Bolton
Measured about 400 m from junction 2, Worsley Braided Interchange, in Bolton
Measured about 400 m from junction 2, Worsley Braided Interchange, in Bolton
Each hour is compared with that sensor’s own free-flow speed rather than the speed limit, because some sensors sit on bends and slip roads that never reach 70 mph. Quiet hours carrying under 600 vehicles are left out, so overnight roadworks are not mistaken for congestion.
Rush hour is rarely symmetrical. The commute in and the commute out peak at different times, and rarely as badly as each other. These speeds are averaged across every sensor facing that way, so they read higher than the worst-point figures above: most of the road is moving even when one junction is not.
| Day | 00 | 1 | 2 | 3 | 4 | 5 | 06 | 7 | 8 | 9 | 10 | 11 | 12 | 13 | 14 | 15 | 16 | 17 | 18 | 19 | 20 | 21 | 22 | 23 |
|---|---|---|---|---|---|---|---|---|---|---|---|---|---|---|---|---|---|---|---|---|---|---|---|---|
| Mon | Mon 00:00, 63 mph, 4% below normal | Mon 01:00, 63 mph, 4% below normal | Mon 02:00, 64 mph, 3% below normal | Mon 03:00, 64 mph, 3% below normal | Mon 04:00, 64 mph, 3% below normal | Mon 05:00, 65 mph, 1% below normal | Mon 06:00, 62 mph, 6% below normal | Mon 07:00, 53 mph, 19% below normal | Mon 08:00, 55 mph, 17% below normal | Mon 09:00, 59 mph, 10% below normal | Mon 10:00, 60 mph, 10% below normal | Mon 11:00, 59 mph, 10% below normal | Mon 12:00, 60 mph, 9% below normal | Mon 13:00, 60 mph, 9% below normal | Mon 14:00, 61 mph, 8% below normal | Mon 15:00, 60 mph, 9% below normal | Mon 16:00, 61 mph, 7% below normal | Mon 17:00, 63 mph, 5% below normal | Mon 18:00, 64 mph, 2% below normal | Mon 19:00, 65 mph, 1% below normal | Mon 20:00, 65 mph, 1% below normal | Mon 21:00, 64 mph, 2% below normal | Mon 22:00, 63 mph, 4% below normal | Mon 23:00, 63 mph, 4% below normal |
| Tue | Tue 00:00, 62 mph, 5% below normal | Tue 01:00, 61 mph, 7% below normal | Tue 02:00, 62 mph, 7% below normal | Tue 03:00, 62 mph, 5% below normal | Tue 04:00, 63 mph, 4% below normal | Tue 05:00, 65 mph, 1% below normal | Tue 06:00, 60 mph, 9% below normal | Tue 07:00, 48 mph, 27% below normal | Tue 08:00, 49 mph, 25% below normal | Tue 09:00, 58 mph, 12% below normal | Tue 10:00, 60 mph, 9% below normal | Tue 11:00, 60 mph, 10% below normal | Tue 12:00, 60 mph, 9% below normal | Tue 13:00, 61 mph, 7% below normal | Tue 14:00, 62 mph, 6% below normal | Tue 15:00, 62 mph, 6% below normal | Tue 16:00, 59 mph, 10% below normal | Tue 17:00, 61 mph, 7% below normal | Tue 18:00, 64 mph, 2% below normal | Tue 19:00, 66 mph, 0% below normal | Tue 20:00, 65 mph, 1% below normal | Tue 21:00, 64 mph, 4% below normal | Tue 22:00, 61 mph, 7% below normal | Tue 23:00, 61 mph, 7% below normal |
| Wed | Wed 00:00, 61 mph, 7% below normal | Wed 01:00, 61 mph, 7% below normal | Wed 02:00, 62 mph, 6% below normal | Wed 03:00, 63 mph, 5% below normal | Wed 04:00, 63 mph, 4% below normal | Wed 05:00, 65 mph, 1% below normal | Wed 06:00, 61 mph, 8% below normal | Wed 07:00, 49 mph, 26% below normal | Wed 08:00, 52 mph, 21% below normal | Wed 09:00, 58 mph, 12% below normal | Wed 10:00, 60 mph, 9% below normal | Wed 11:00, 60 mph, 9% below normal | Wed 12:00, 61 mph, 7% below normal | Wed 13:00, 62 mph, 7% below normal | Wed 14:00, 62 mph, 6% below normal | Wed 15:00, 62 mph, 6% below normal | Wed 16:00, 60 mph, 9% below normal | Wed 17:00, 58 mph, 11% below normal | Wed 18:00, 64 mph, 3% below normal | Wed 19:00, 66 mph, 0% below normal | Wed 20:00, 65 mph, 1% below normal | Wed 21:00, 65 mph, 2% below normal | Wed 22:00, 63 mph, 4% below normal | Wed 23:00, 63 mph, 4% below normal |
| Thu | Thu 00:00, 62 mph, 5% below normal | Thu 01:00, 62 mph, 6% below normal | Thu 02:00, 62 mph, 6% below normal | Thu 03:00, 62 mph, 5% below normal | Thu 04:00, 63 mph, 4% below normal | Thu 05:00, 65 mph, 1% below normal | Thu 06:00, 62 mph, 6% below normal | Thu 07:00, 49 mph, 26% below normal | Thu 08:00, 53 mph, 20% below normal | Thu 09:00, 59 mph, 11% below normal | Thu 10:00, 60 mph, 9% below normal | Thu 11:00, 60 mph, 9% below normal | Thu 12:00, 61 mph, 8% below normal | Thu 13:00, 61 mph, 8% below normal | Thu 14:00, 61 mph, 8% below normal | Thu 15:00, 61 mph, 8% below normal | Thu 16:00, 57 mph, 13% below normal | Thu 17:00, 59 mph, 10% below normal | Thu 18:00, 64 mph, 3% below normal | Thu 19:00, 66 mph, 0% below normal | Thu 20:00, 65 mph, 1% below normal | Thu 21:00, 64 mph, 3% below normal | Thu 22:00, 63 mph, 4% below normal | Thu 23:00, 63 mph, 4% below normal |
| Fri | Fri 00:00, 63 mph, 4% below normal | Fri 01:00, 62 mph, 5% below normal | Fri 02:00, 63 mph, 5% below normal | Fri 03:00, 63 mph, 4% below normal | Fri 04:00, 63 mph, 4% below normal | Fri 05:00, 65 mph, 1% below normal | Fri 06:00, 65 mph, 2% below normal | Fri 07:00, 61 mph, 8% below normal | Fri 08:00, 62 mph, 6% below normal | Fri 09:00, 61 mph, 7% below normal | Fri 10:00, 59 mph, 10% below normal | Fri 11:00, 56 mph, 15% below normal | Fri 12:00, 55 mph, 16% below normal | Fri 13:00, 53 mph, 19% below normal | Fri 14:00, 54 mph, 18% below normal | Fri 15:00, 54 mph, 18% below normal | Fri 16:00, 51 mph, 23% below normal | Fri 17:00, 54 mph, 18% below normal | Fri 18:00, 59 mph, 10% below normal | Fri 19:00, 64 mph, 3% below normal | Fri 20:00, 65 mph, 1% below normal | Fri 21:00, 64 mph, 3% below normal | Fri 22:00, 63 mph, 4% below normal | Fri 23:00, 64 mph, 3% below normal |
| Sat | Sat 00:00, 64 mph, 4% below normal | Sat 01:00, 63 mph, 4% below normal | Sat 02:00, 63 mph, 4% below normal | Sat 03:00, 63 mph, 4% below normal | Sat 04:00, 64 mph, 3% below normal | Sat 05:00, 65 mph, 1% below normal | Sat 06:00, 66 mph, 0% below normal | Sat 07:00, 66 mph, -1% below normal | Sat 08:00, 66 mph, 0% below normal | Sat 09:00, 65 mph, 2% below normal | Sat 10:00, 62 mph, 6% below normal | Sat 11:00, 60 mph, 9% below normal | Sat 12:00, 60 mph, 8% below normal | Sat 13:00, 62 mph, 5% below normal | Sat 14:00, 63 mph, 4% below normal | Sat 15:00, 65 mph, 2% below normal | Sat 16:00, 65 mph, 2% below normal | Sat 17:00, 65 mph, 1% below normal | Sat 18:00, 66 mph, 0% below normal | Sat 19:00, 67 mph, -1% below normal | Sat 20:00, 66 mph, -1% below normal | Sat 21:00, 65 mph, 1% below normal | Sat 22:00, 62 mph, 5% below normal | Sat 23:00, 63 mph, 4% below normal |
| Sun | Sun 00:00, 63 mph, 5% below normal | Sun 01:00, 64 mph, 3% below normal | Sun 02:00, 63 mph, 4% below normal | Sun 03:00, 64 mph, 2% below normal | Sun 04:00, 65 mph, 2% below normal | Sun 05:00, 66 mph, 0% below normal | Sun 06:00, 67 mph, -1% below normal | Sun 07:00, 67 mph, -1% below normal | Sun 08:00, 66 mph, -1% below normal | Sun 09:00, 65 mph, 1% below normal | Sun 10:00, 63 mph, 4% below normal | Sun 11:00, 61 mph, 7% below normal | Sun 12:00, 61 mph, 8% below normal | Sun 13:00, 61 mph, 7% below normal | Sun 14:00, 64 mph, 4% below normal | Sun 15:00, 64 mph, 3% below normal | Sun 16:00, 64 mph, 3% below normal | Sun 17:00, 64 mph, 3% below normal | Sun 18:00, 65 mph, 1% below normal | Sun 19:00, 66 mph, 0% below normal | Sun 20:00, 65 mph, 1% below normal | Sun 21:00, 64 mph, 2% below normal | Sun 22:00, 63 mph, 4% below normal | Sun 23:00, 64 mph, 3% below normal |
Nothing was confirmed closed at our last check of the National Highways feed (1:38am today, UK time), but 3 closures are booked in the next 24 hours, the first due from 10pm, so it may already be in place. This covers planned roadworks and lane closures, not accidents.
National Highways has 3 closures booked on the M61 in the next 24 hours, the first due from 10pm, so it may already be in place: M61 Southbound lane 1 closure (MP 3/3 to 0/8); M61 southbound lanes 2 and 3 closure (MP 10/3 to 8/5); and M61 Southbound to M60 Clockwise link road lane 2 closure. Plans can change on the night.